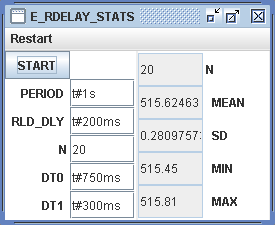
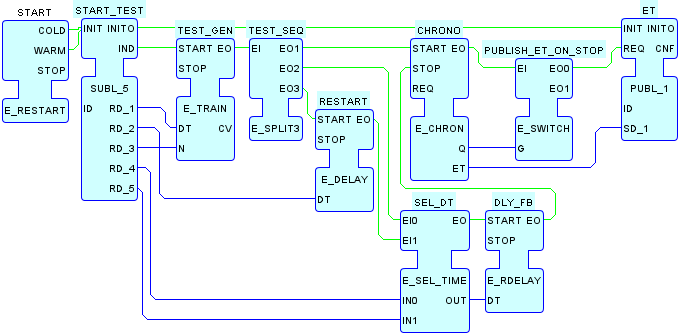
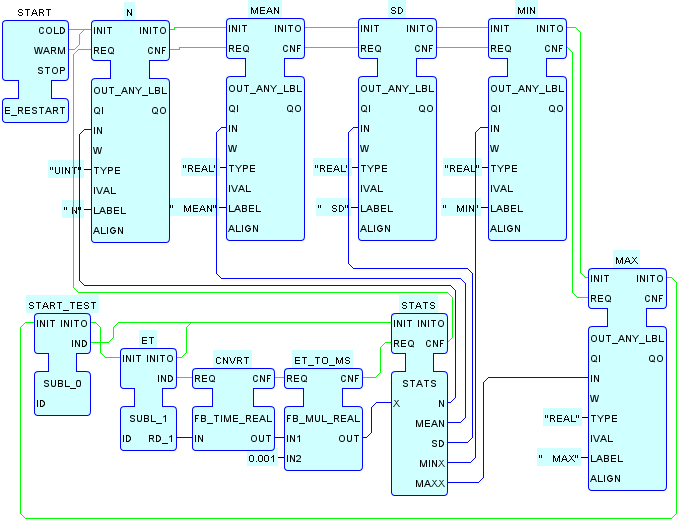
This System Configuration gathers and displays statistical data on
the timing performance of an instance of the E_RDELAY Function
Block (FB) type (DLY_FB in the TESTER
Resource). Table 4 presents the statistics
obtained by running the test parameter sets listed in Table 3 on the platforms listed in Table 2 with the specified Java Virtual Machine
(JVM) versions.
In the ideal situation for event handling function blocks described
in Annex A of IEC 61499-1, the value of the CHRONO.ET
output upon the occurrence of an event at the CHRONO.EO
output in the TESTER
Resource would be RELOAD_DLY + DT1 in Test
Cases 1, 2, and 3, and DT0 in Test Case 4. However, it
is apparent from Table 4 that overheads and
indeterminacies of event processing and delay scheduling are causing
the actual CHRONO.ET value to be RELOAD_DLY + DT1 +x,
where x is a randomly distributed variable with a mean value
less than 1 millisecond on all tested platforms except W10.
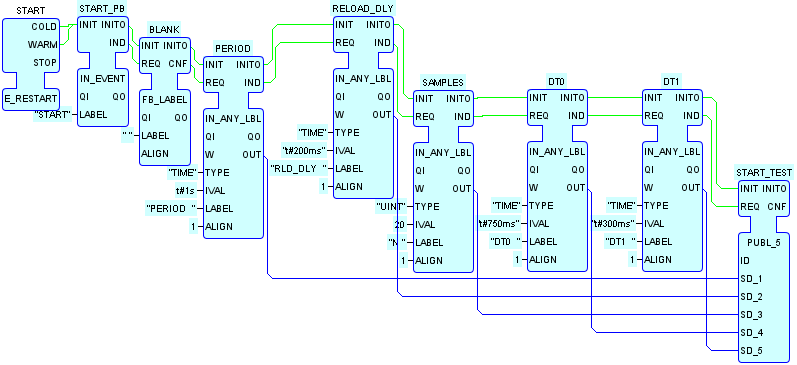
Table 1 - Test Parameters
PERIOD: The interval at which tests are to be
performed.
RELOAD_DLY: The interval between the first
and second occurrences of a START event issued to
the E_RDELAY instance in each test.
N: The number of tests to be performed.
DT0: The DT value upon the first
occurrence of a START event issued to the E_RDELAY
instance in each test.
DT1: The DT value upon the
second occurrence of a START event issued to the E_RDELAY
instance in each test.
This System configuration uses the Local
Multicast design pattern for the communication of data and events
among Resources. The FBDK uses the Tagged
Data design pattern to ensure consistency of the communicated events
and data, as shown in the table below.